Monitoring Fishmeal & Fish Oil Production at Gunjur
Senegambian Coast
Artisanal fishers in Senegal and The Gambia are increasingly caught between offshore industrial fishing and a fast-growing shore-based fish meal / fish oil (FMFO) industry1. While the impact of the former has been the subject of numerous studies that have tried to detect and quantify the scale of fish stock depletion it is responsible for, the latter has so far received far less attention. Even if the disastrous effects of FMFO production in The Gambia – and more generally along the West African coast – have been amply denounced by local populations as well as international organizations and journalists. In the absence of any official data monitoring FMFO production in The Gambia this study sets out to develop a model for detecting and documenting the activities and locations of artisanal fishing fleets, upon which the FMFO factories depend.
This preliminary study focuses on in the Gambian coastal village of Gunjur, where the Golden Lead FMFO factory2 opened in 2016. The study employs remote sensing techniques to detect the presence of artisanal fishing vessels gathering to land their catch in the Bay of Gunjur during the 6 months of FMFO factories activity, between November and June. This framework allows for the study of changes in the activities and numbers of artisanal fishing brought about by the factory’s operations. Whilst providing insights into practices of temporary migration between Senegal and The Gambia driven by FMFO production.
We present an open, reproducible workflow that applies simple spectral indices to fourteen PlanetScope scenes (2018–2024, 3 m spatial resolution) to detect small wooden and fiberglass boats operating in Gunjur Bay. A scene-specific Normalised Difference Water Index (NDWI) threshold, morphological cleaning and 4 connected component analysis isolate vessel footprints. Early counts illustrate the potential for community-led oversight while underscoring the caution required when drawing conclusions from single and isolated snapshots. This methodologylays out the groundwork for further in-depth studies with increased access to satellite imagery, providing deeper insights into changes in artisanal fishing practices following the emergence of West Africa as a crucial FMFO global exporter. Conversely, it must be noted that the number of boats provides only an indirect—and imperfect—proxy for estimating the volume of fish stock consumed by factories, as vessel presence alone does not reflect catch size, fishing effort, or ultimate usage.
Methodology
The PDF report outlines a reproducible workflow that applies simple spectral indices to fourteen PlanetScope scenes. The workflow utilizes the complete Python script (including all preprocessing, NDWI calculation, mask generation, and vessel‐detection routines) provided available via the following link. To run the workflow as described in the report, you will need a Python 3 environment with the following packages installed; numpy (for array operations), matplotlib (for image plotting and annotation), scipy (specifically scipy.stats and scipy.ndimage for mode filtering, morphological operations, and connected‐component labeling), GDAL/OGR (via the osgeo bindings, for reading the multispectral TIFF and rasterizing the bay polygon), rasterio (for writing out georeferenced GeoTIFFs), geopandas and shapely (for any vector‐based manipulations, although most raster/vector interoperability is handled via GDAL), mpl_toolkits.axes_grid1 (for fixed‐positioncolorbars when plotting NDWI). Before beginning, ensure that these libraries (and their dependencies) are correctly installed in your Python environment so that all code cells in the script execute without error.
First, we create a true‐color image3 by stacking the red, green, and blue bands, resulting in a composite that is immediately recognizable and inspectable by any analyst. From this composite, we calculate the Normalized Difference Water Index (NDWI4), which accentuates open water (bright) and suppresses other features such as land, boats, and glare (dark). Because atmospheric conditions—such as cloud cover, suspended sediments, and sun glint—vary from one acquisition to the next, the optimal NDWI threshold cannot be predetermined. We employed a systematic, image‐by‐image approach: for each scene, we test a sequence of candidate thresholds (typically ranging from 0.1 to 0.4) and select the one that most effectively separates water from boats and other bright artifacts. Under calm, clear‐water conditions, thresholds around 0.10–0.15 generally suffice; in contrast, when turbidity is high or sun glint is pronounced (for example, during hazier afternoons), a higher threshold—up to 0.25–0.30—is required to prevent misclassifying glint‐contaminated or sediment‐loaded water as vessels. All pixels with NDWI values above the chosen threshold are labeled as “water,” while pixels below the threshold are retained as potential vessel candidates or non‐water noise. Once the initial binary water mask is generated, we apply a 3 × 3 mode filter to eliminate “salt‐and‐pepper” noise—small clusters of pixels that might represent wave crests, foam, or fleeting glint rather than actual boats. Each pixel is replaced by the most frequently occurring value in its 3 × 3 neighborhood, thereby removing isolated misclassifications without disturbing contiguous water areas or actual boats. After mode of filtering, we quickly clean the mask by filling in small holes and removing narrow gaps. This produces a smooth, continuous water mask so that genuine boats are not broken up in later steps. It ensures that small imperfections do not fragment the shapes of legitimate vessels in later steps.
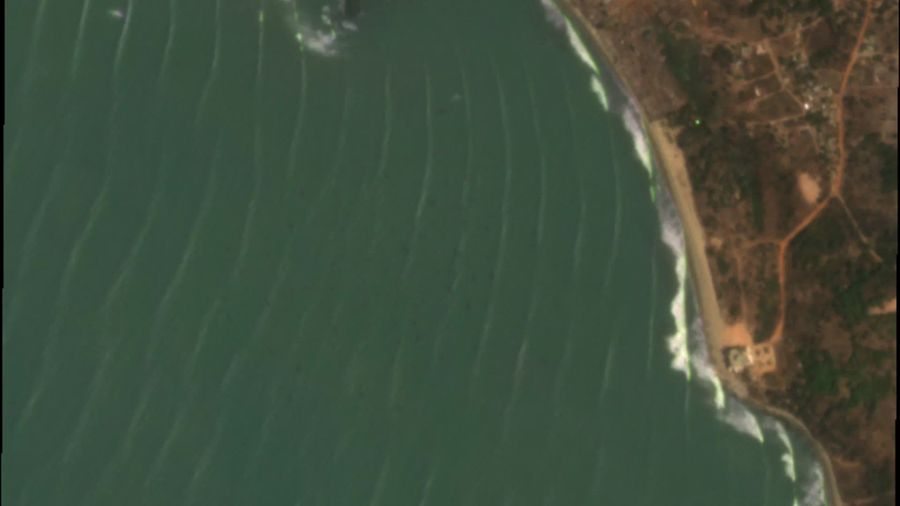
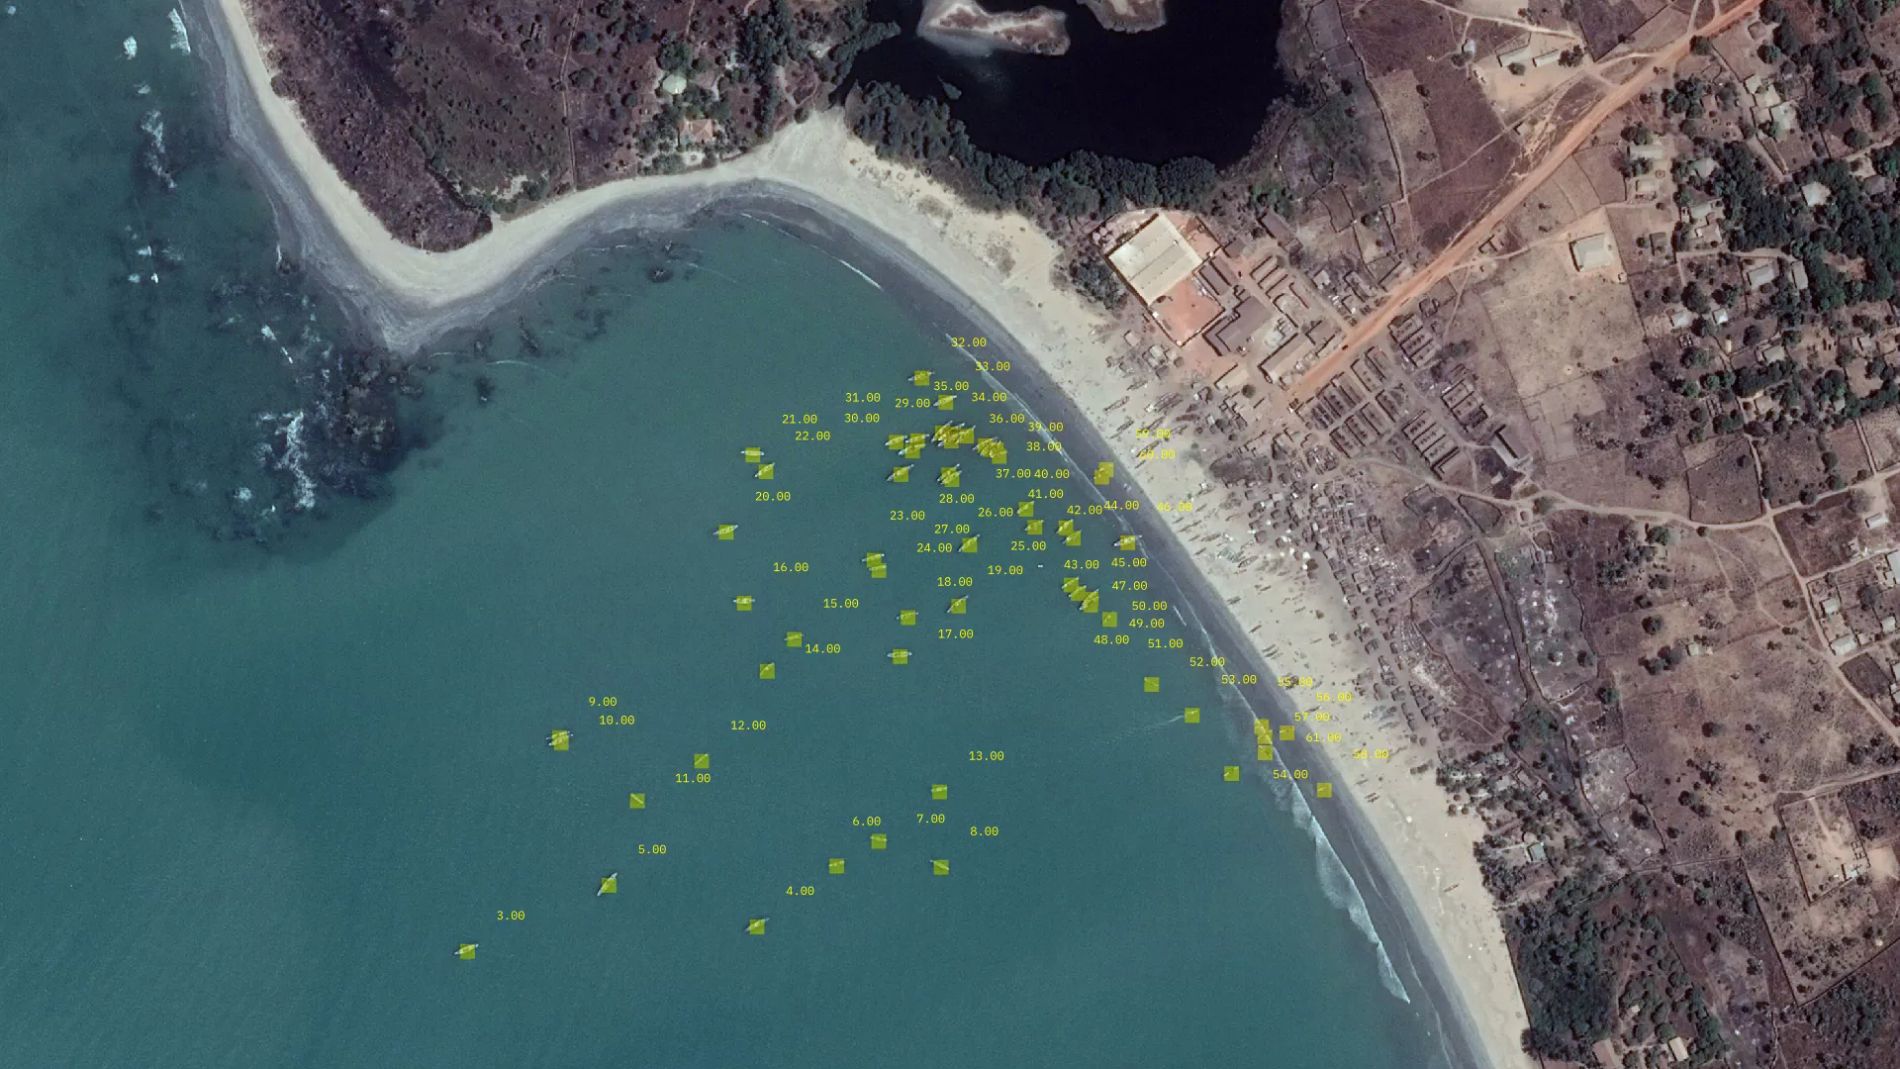
Applying a basic NDWI image processing to reveal fishing locations at Gunjur beach, site of The Golden Lead fishmeal & fish oil factory
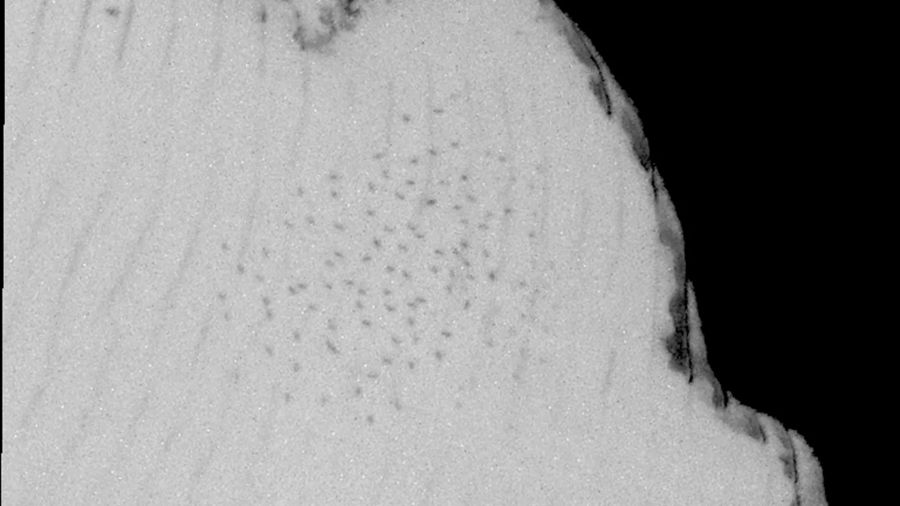
Next, we crop the cleaned water mask to the polygon outlining Gunjur Bay by rasterizing that polygon. This step eliminates surf‐zone foam from consideration, breaking waves along the shoreline, and nearshore turbidity. The resulting mask contains only true water pixels within the bay’s legal boundary. To detect individual vessels, we invert this water mask which turns boats and other dark features into bright dots5. We then run a connected‐component analysis using 4‐connectivity—meaning that pixels are grouped only if they share a full edge, not merely a corner—so that each cluster represents a contiguous object. Clusters whose pixel area falls between 6 and 300 are retained as potential boats: clusters smaller than 6 pixels are likely foam flecks or residual noise, while clusters larger than 300 pixels are more likely sandbars, dock shadows, or substantial glint artifacts. The remaining clusters become our final ship candidates. Finally, we overlay red bounding rectangles around each detected cluster on both the true‐color composite and the NDWI layer, producing annotated images that allow a human analyst to perform a rapid double check before any further analysis. In practice, this entire workflow—from band stacking through vessel annotation—executes in under 30 seconds per image on a standard laptop.
Results
Over the seven‐year period from 2018 through 2024, the number of vessels detected in Gunjur Bay exhibits a pronounced upward trend, punctuated by year‐to‐year fluctuations that reflect both fishing effort and environmental factors influencing detectability. In 2018, the two March and April scenes produced vessel counts of 33 and 42, respectively, yielding an average of 37.5 boats. By 2019, this average rose to 55.0 boats—an increase of approximately 47% over the previous year. The momentum continued into 2020, where counts averaged 77.5, representing a further 41% rise from 2019. The peak of this early upward trajectory occurred in 2021, when imagery recorded a mean of 100. These successive annual gains suggest a genuine intensification of fishing activity in addition to consistently favorable imaging and detection of conditions that made boats easily visible with this method.
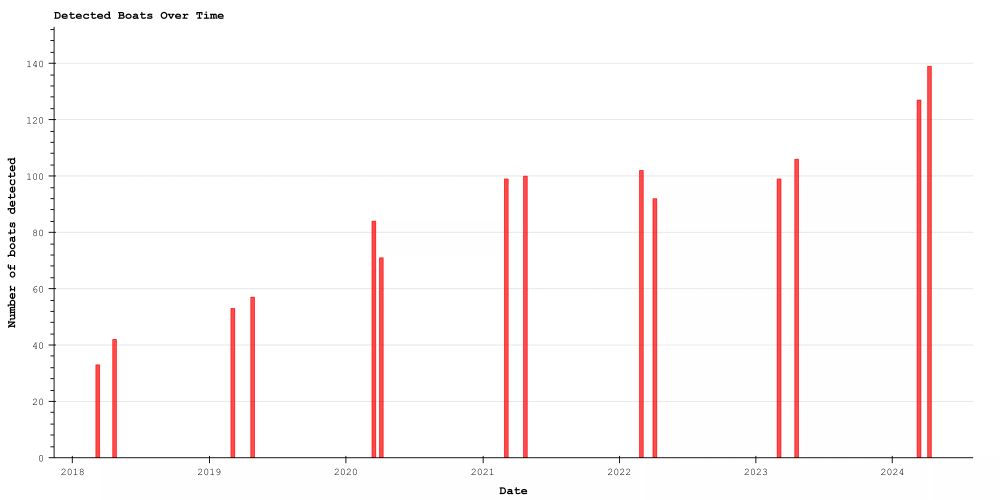
Initial results as published in the full report
Satellite snapshots—even when sparse—offer good data insights surrounding Gunjur’s fishing economy. Our method demonstrates that a single multispectral index, adjusted per scene, suffices to map medium‐sized pirogues without relying on expensive, proprietary imagery or bespoke machine‐learning training data. The algorithm is straightforward to understand, and the hands‐on thresholding approach makes it accessible to non‐specialists. By distributing open‐source code6 alongside side‐by‐side visual outputs, we foster transparency and enable community observers, journalists, and local stakeholders to audit or replicate the workflow. Nevertheless, the very simplicity that renders this method portable also imposes certain limitations. A satellite image is merely a snapshot in time: a calm anchorage at late afternoon may simply indicate a random and punctual decrease in activity rather than a true absence of boats.
At 3 m resolution, six‐meter boats hover on the edge of detectability7, and vessels navigating side by side frequently merge into a single blob, complicating precise counts. Environmental noise—sun glint, sediment plumes, or afternoon cumulus—can occasionally pass through threshold tuning, leading to false positives or missed detections. Moreover, scene‐specific threshold selection, despite its pragmatic advantages, introduces a degree of subjectivity that complicates strict time‐series comparisons across images. Quantifying precision remains challenging in the absence of perfectly synchronous ground truth; however, manual inspections on clearer scenes suggest error rates of less than 10 %, which provides sufficient confidence for many practical applications.
In conclusion, this low‐cost, open‐source approach offers an accessible alternative to expensive satellite platforms. While single‐moment counts cannot quantify fishing intensity outright or temporary migration patterns associated with the factory's operations, they reveal pulses of activity that align with factory demand and local testimonies. As such, this method provides civil society groups, regulators, and researchers with a scalable tool for initial oversight, democratizing access to near‐real‐time information on artisanal fishing dynamics.